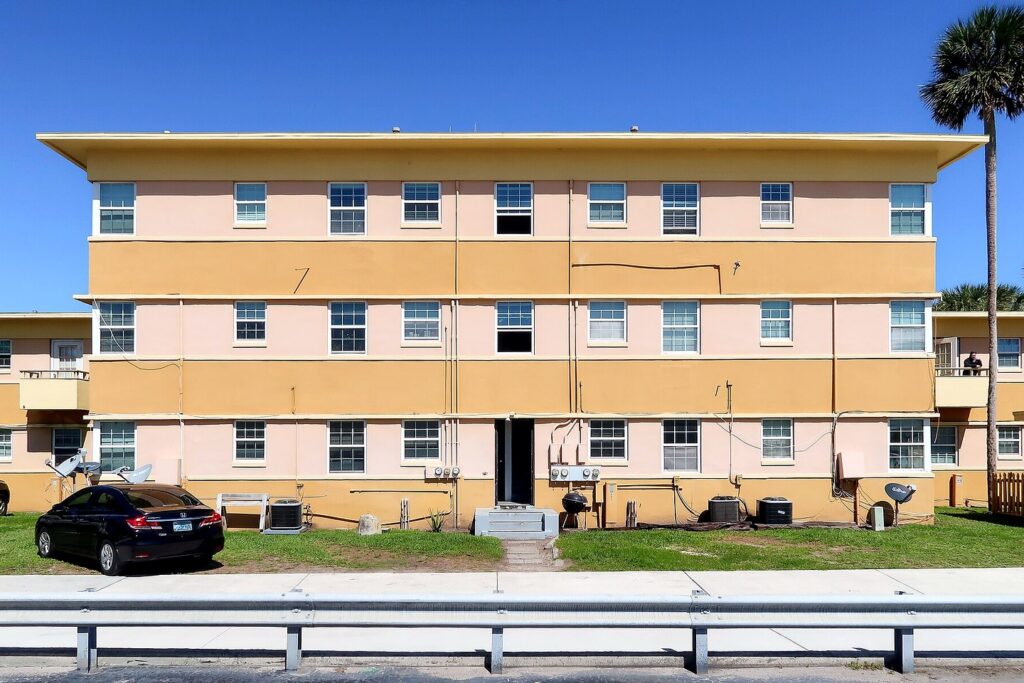
Orlando Housing Market: U.S. Building Permits Fall 7.4% in October, Single-Family Permits Drop 8.7%
Long before a family steps into a sales center outside Kissimmee, builders across the country pulled back on paper — cutting U.S. building permits 7.4% in October to a 1.295 million pace, with single-family permits down 8.7%.
4 minute read
Real Estate & Growth
Orlando Housing Market: U.S. Building Permits Fall 7.4% in October, Single-Family Permits Drop 8.7%
For a family waiting on the next phase of a new subdivision outside Kissimmee, the decision that matters most is never made inside a sales center. It is made months earlier, on paper, when a builder decides whether to pull a permit at all.
In October, builders across the country pulled far fewer of them. U.S. building permits fell 7.4% to a seasonally adjusted annual rate of 1,295,000, and single-family permits dropped 8.7% to 772,000, according to the New Residential Construction release for October 2026, published November 18, 2026, by the U.S. Census Bureau and the U.S. Department of Housing and Urban Development.
Permits are the housing market’s earliest hard number — an authorization to build, issued before ground is broken — and the October reading is the weakest in the release’s own monthly table. The overall pace fell from a revised 1,398,000 in September and stood 8.7% below the October 2025 rate of 1,418,000; the single-family rate of 772,000 fell below every month the release tabulates back to October 2025. Authorizations for units in buildings with five or more units stood at a rate of 475,000. Because the Census Bureau does not publish a metro-Orlando permit rate in this release, these remain national figures — reported by this desk not as an Orlando count, but as the national and regional pipeline behind Kissimmee‘s and the metro’s new subdivisions.
The South fell faster than the country
Turn to the regional table in the same release, and the slowdown concentrates where Orlando sits. Permits in the South fell 10.7% from September to a rate of 675,000, down 8.3% from a year earlier, while Southern single-family authorizations dropped 7.5% for the month to 466,000 — a 9.7% decline year over year.
In the Census table, the South is the country’s largest building region by a wide margin. A retreat of this scale is the part of the release most likely to reach Central Florida’s construction corridors — the same corridors where this desk counted a 252-unit apartment community already under construction near NeoCity on financing arranged before this pullback.
Starts rose, but the release will not certify the rise
Construction itself appeared to move the other way — on paper. Housing starts ran at a rate of 1,309,000 in October, up 9.9% from September’s revised 1,191,000, and single-family starts rose 4.0% to 864,000. Yet the statistical fine print withholds any confirmation. The release attaches a 90% confidence interval of plus or minus 16.8 percentage points to the total starts change and plus or minus 9.0 points to the single-family change; both ranges include zero, which in the Census Bureau’s own notation means there is insufficient statistical evidence to conclude the change was different from zero.
Completions — homes actually finished — carry the same caveat. The total rate stood at 1,272,000, up 6.5% from September and down 10.4% from October 2025, with single-family completions at 900,000; margins of plus or minus 13.2 percentage points on the monthly move and 11.6 points on the annual move leave those changes uncertified as well. Narrowed to what the data will support, the release states only one October shift without a statistical caveat: the permit decline. Builders authorized measurably fewer homes to come, while starts and completions moved inside ranges that include no change at all.
Across Orlando’s areas, that leaves a supply question deferred rather than answered. The metro’s for-sale inventory reached 12,762 homes in October, the highest of 2026 on the Orlando Regional REALTOR® Association’s count — a separate figure this desk reported in its October sale-price story. If the national and Southern permit declines persist, the new-construction share of that inventory thins into 2027; if October proves to be a single irregular month — the release cautions that it can take three months to establish an underlying trend for permits — the subdivision pipeline refills. The November construction report is scheduled for release on December 17, 2026, when this desk will continue the series alongside the contract-signing picture in NAR’s October pending-sales report.
More from this desk: the Real Estate & Growth archive and the Citizen’s beat reporters index.
Sources & notes: All construction figures are from the U.S. Census Bureau and U.S. Department of Housing and Urban Development, Monthly New Residential Construction, October 2026 (Release CB26-187, released November 18, 2026), read in full by this desk, including Table 1a. Rates are seasonally adjusted annual rates. Building permits: total 1,295,000 (−7.4% vs revised September 1,398,000; −8.7% vs October 2025’s 1,418,000); single-family 772,000 (−8.7% vs September’s 846,000); buildings with five or more units 475,000. South region permits: total 675,000 (−10.7% month over month, −8.3% year over year); single-family 466,000 (−7.5% month over month, −9.7% year over year). Starts: total 1,309,000 (+9.9% ±16.8 points — the 90% confidence interval includes zero, so the change is not statistically significant, as the release’s asterisk denotes); single-family 864,000 (+4.0% ±9.0, likewise not significant). Completions: total 1,272,000 (+6.5% ±13.2 points month over month, −10.4% ±11.6 year over year — both intervals include zero, as the release’s asterisks denote); single-family 900,000. The release notes a scheduled Survey of Construction sample redesign beginning with the January 2027 report (February 18, 2027). The ORRA inventory figure (12,762, October 2026) is from this desk’s prior reporting, linked in the story, and is a separate measure. Featured photograph is a file photograph from a related Citizen story in this series.
Orlando Citizen by email
The weekly edition, in your inbox
One email, every Saturday: the week’s edition of Orlando Citizen — the week’s stories, rankings and winners, gathered in one place. Free, and you can unsubscribe at any time.
Related Stories
 Real Estate & GrowthOrlando Rent Prices: Renting a House Takes $16,911 Less Income Than Buying One, Zillow Finds
 Real Estate & GrowthOrlando Growth: 300,000 New Residents Since 2020, and a $400,000 Home Testing Whether They Can StayReal Estate & GrowthOrlando Home Prices: Single-Family Median Slips to $439,685 as Metro Sales Fall 9.2% in October
Editor’s Picks
Spotted an error? Tell us — corrections · How we rank