51.45 Inches a Year: Orlando’s Climate by the Numbers
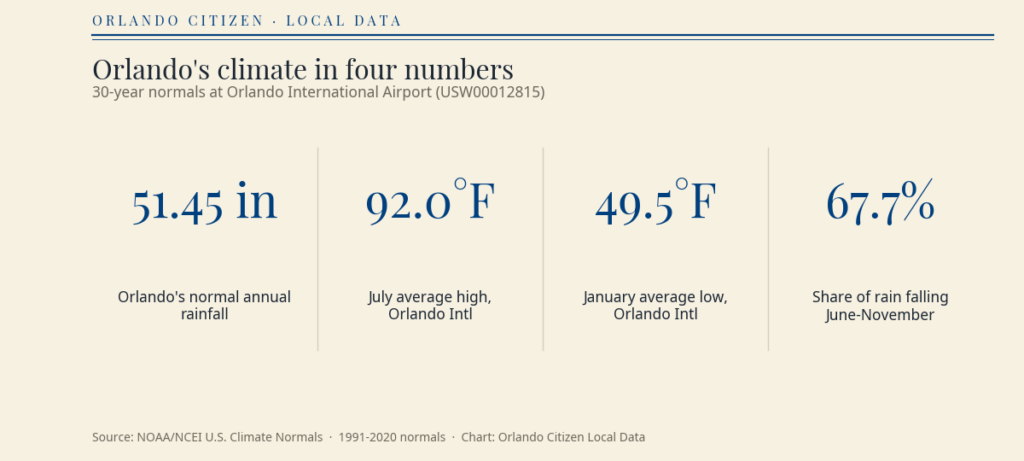
NOAA's 1991–2020 normals for Orlando International put the year's rainfall at 51.45 inches — and 67.7 percent of it falls in the June–November hurricane season.
2 minute read
Orlando’s climate, in the official 30-year record, is a story of one wet season and one long warm one. The normals NOAA publishes for Orlando International Airport — the averages of 1991 through 2020 — put the year’s rainfall at 51.45 inches, and more than two-thirds of it falls between June and November.
- 51.45 inches — normal annual rainfall at Orlando International Airport
- 92.0°F — July’s normal average high — the hottest month
- 49.5°F — January’s normal average low — the coldest reading of the year
- 67.7% — share of the year’s rain that falls in the June–November hurricane season (34.82 of 51.45 inches)

The wet season is not a gentle ramp. June is the wettest month at 8.05 inches, followed by August at 7.69 and July at 7.46. The driest months are November (1.79 inches) and February (2.04). A resident planning around the weather is really planning around that June-to-September block, when afternoon storms are a near-daily feature and the year’s flood risk concentrates.

Temperature moves in a narrower band than visitors expect. The normal average high climbs from 71.8°F in January to 92.0°F in July, and the normal average low never drops below 49.5°F. The annual mean temperature is 73.0°F. What changes through the year is less the heat than the humidity and the rain that comes with it.

These are normals, not a forecast: they describe the 30-year average conditions at one airport station, and any single year can sit well above or below them. The station pieces in this series — Sanford, Kissimmee and Leesburg — show how much the picture shifts within the metro.
The numbers
| Month | Avg high (°F) | Avg low (°F) | Rainfall (in) |
|---|---|---|---|
| January | 71.8 | 49.5 | 2.48 |
| February | 74.9 | 52.4 | 2.04 |
| March | 78.9 | 55.8 | 3.03 |
| April | 83.6 | 60.7 | 2.58 |
| May | 88.4 | 66.3 | 4.02 |
| June | 90.8 | 71.6 | 8.05 |
| July | 92.0 | 73.2 | 7.46 |
| August | 91.6 | 73.7 | 7.69 |
| September | 89.6 | 72.4 | 6.37 |
| October | 84.7 | 66.2 | 3.46 |
| November | 78.3 | 58.2 | 1.79 |
| December | 73.8 | 52.9 | 2.48 |
More Local Data
- Local Data hub — every data feature
- Sanford’s climate normals
- Kissimmee’s climate normals
- Leesburg’s climate normals
- Metro water and springs, by the numbers
Sources & notes
Key facts in this article were checked against:
- NOAA/NCEI — U.S. Climate Normals 1991–2020, monthly station file for Orlando International (USW00012815) — confirms the monthly temperature and precipitation normals used throughout the climate pieces
Data note: Publisher: NOAA National Centers for Environmental Information. Dataset: U.S. Climate Normals 1991–2020, monthly and annual/seasonal station CSV products. Vintage: 1991–2020 normals period. Retrieval date: 2026-11-15. Geography: station USW00012815, Orlando International Airport. Hurricane-season share computed by the Citizen from the published monthly normals (June–November sum divided by the annual sum).
Orlando Citizen by email
The weekly edition, in your inbox
One email, every Saturday: the week’s edition of Orlando Citizen — the week’s stories, rankings and winners, gathered in one place. Free, and you can unsubscribe at any time.
Related Stories


Editor’s Picks
Spotted an error? Tell us — corrections · How we rank